26 Apr What’s happening in Year 5 – Week 2
In Year 5 this term, we have really noticed how our learning in different subjects links together.
In maths, we completed our statistics topic, in which we learnt to analyse tables of data and represent it using graphical representations.
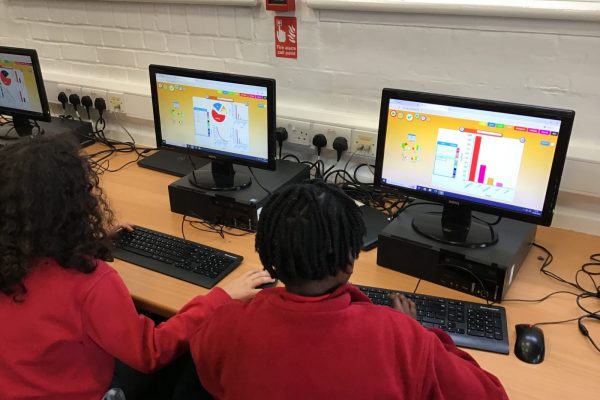
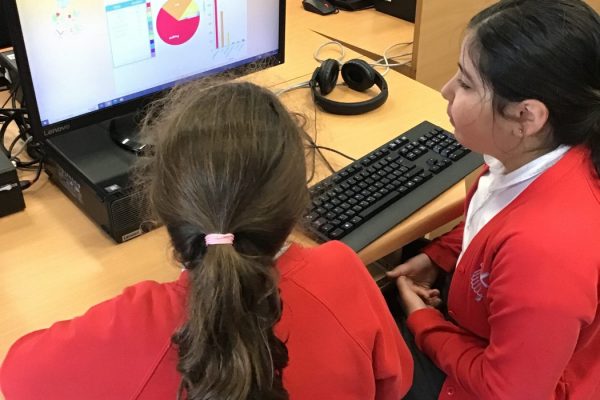
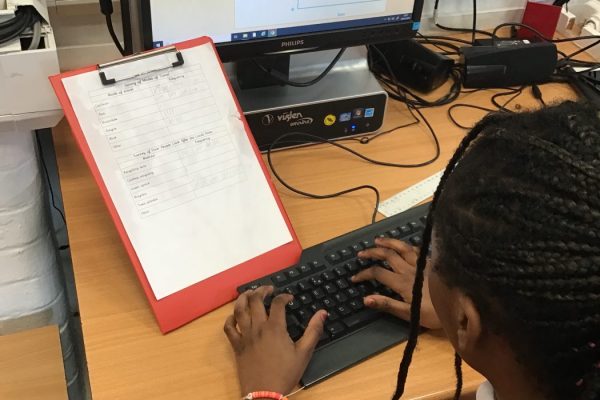
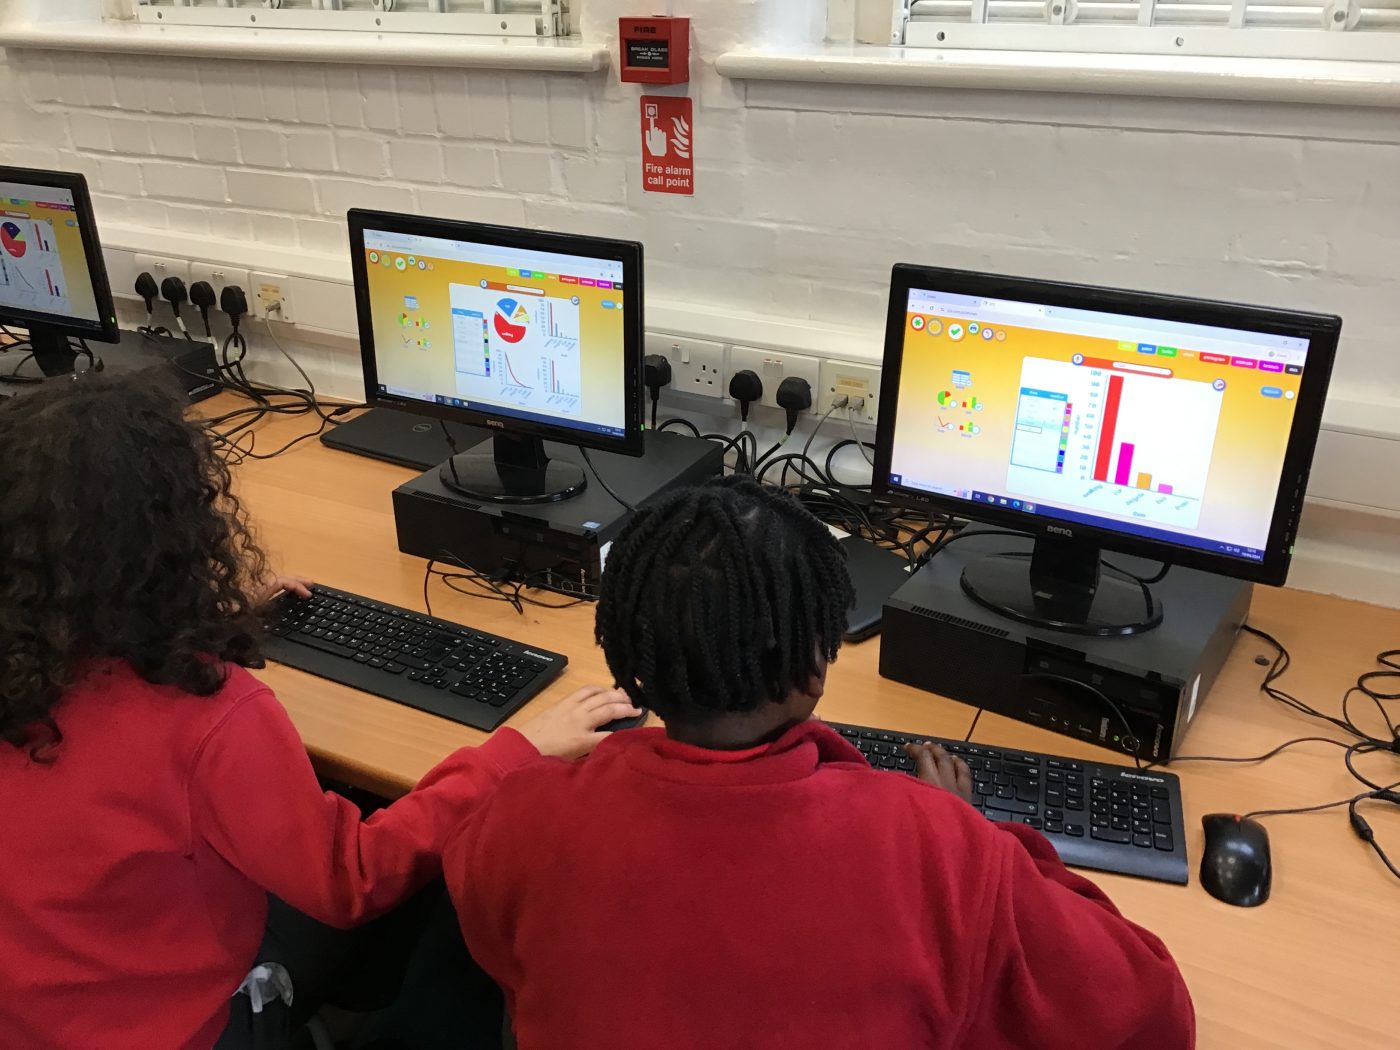
During our geography fieldwork, we applied this knowledge by using a table to record a transport survey. We then used our computing skills to input the data into a programme that creates bar charts, line graphs and pie charts to represent our findings.
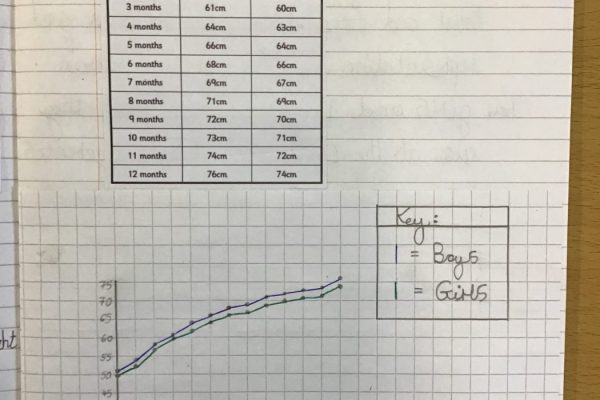
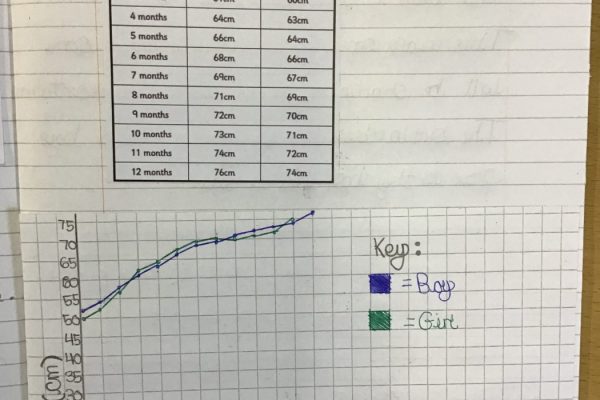
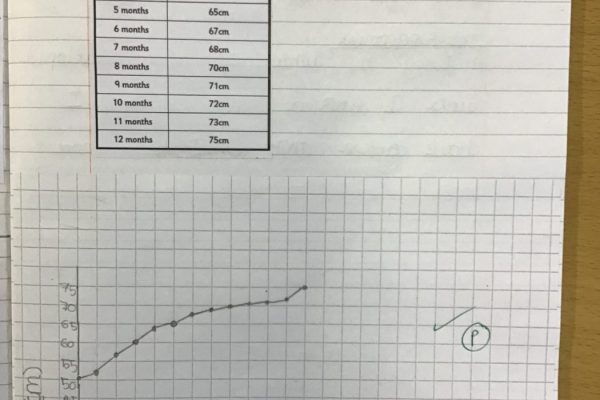
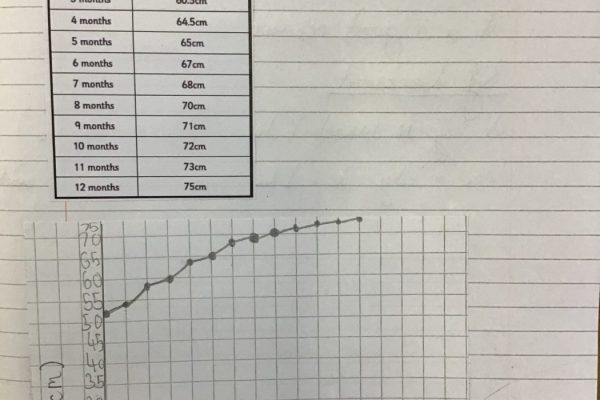
In science, we drew our own line graphs to represent the average heights of children as they grow, as part of our ‘animals including humans’ topic. We used feedback from our maths lessons to ensure we drew our graphs accurately, particularly focusing on the skills of writing a scale.
Some of us challenged ourselves to represent two data sets on one axis, using a key to differentiate between the two lines.
